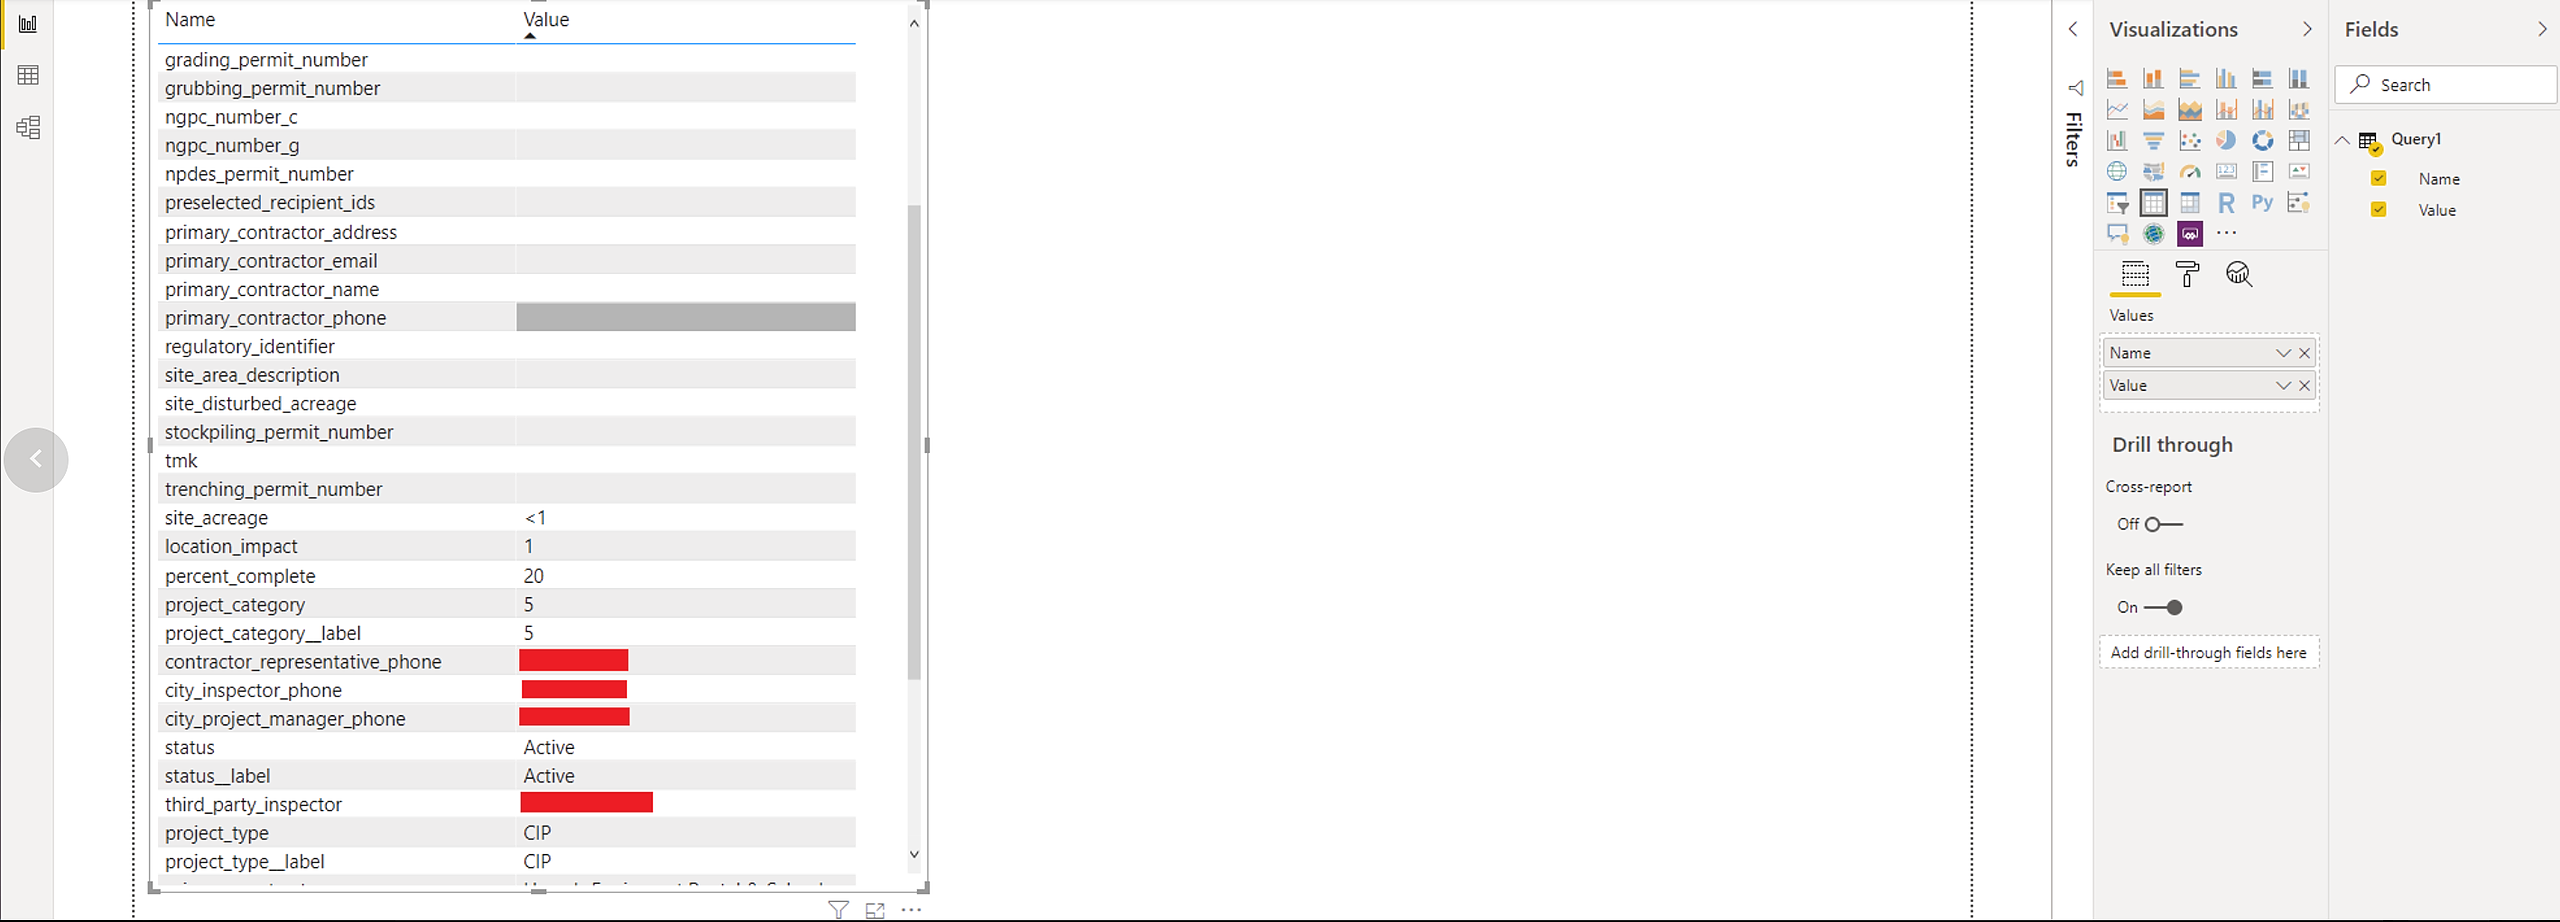
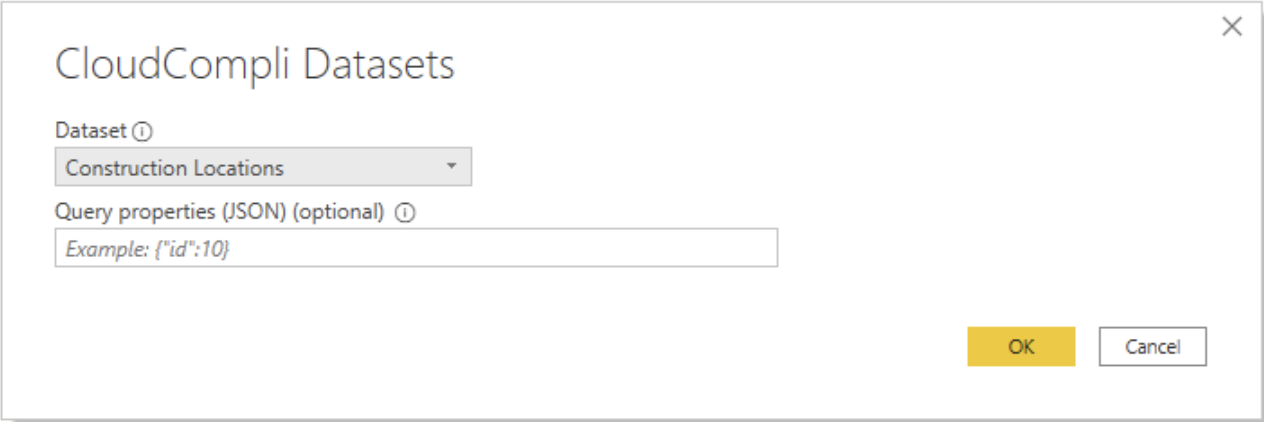
As an example, I will use the "Construction Locations" dataset. Note: Your data might look different. This example uses data from a Municipality that provided access to their data via their API tokens generated within CloudCompli.
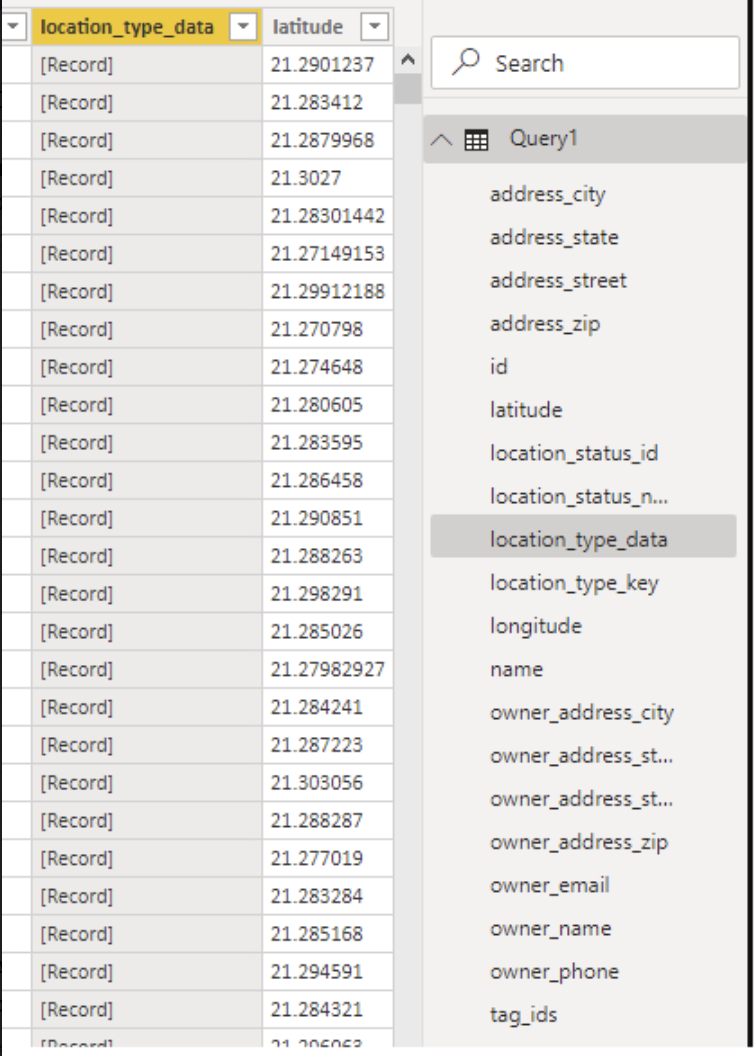
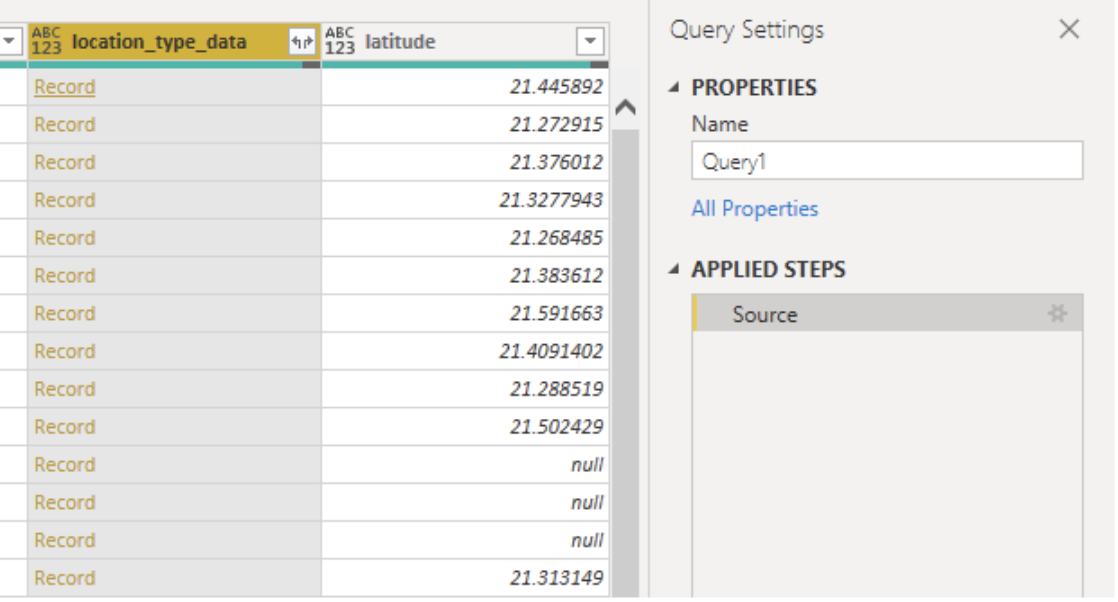
Once you've pulled the Construction Locations dataset and loaded it in, you'll want to look at the Query and the data columns, and look for a column that contains something called a [Record]. [Record]s are typically what happens to a schema-less JSON column of nested data, that PowerBI automatically detects and transforms into a [Record].
In this particular example, this column is called "location_type_data". The "_data" suffix is usually a good indicator, in any of our datasets, that there may be additional nested data in that one column.
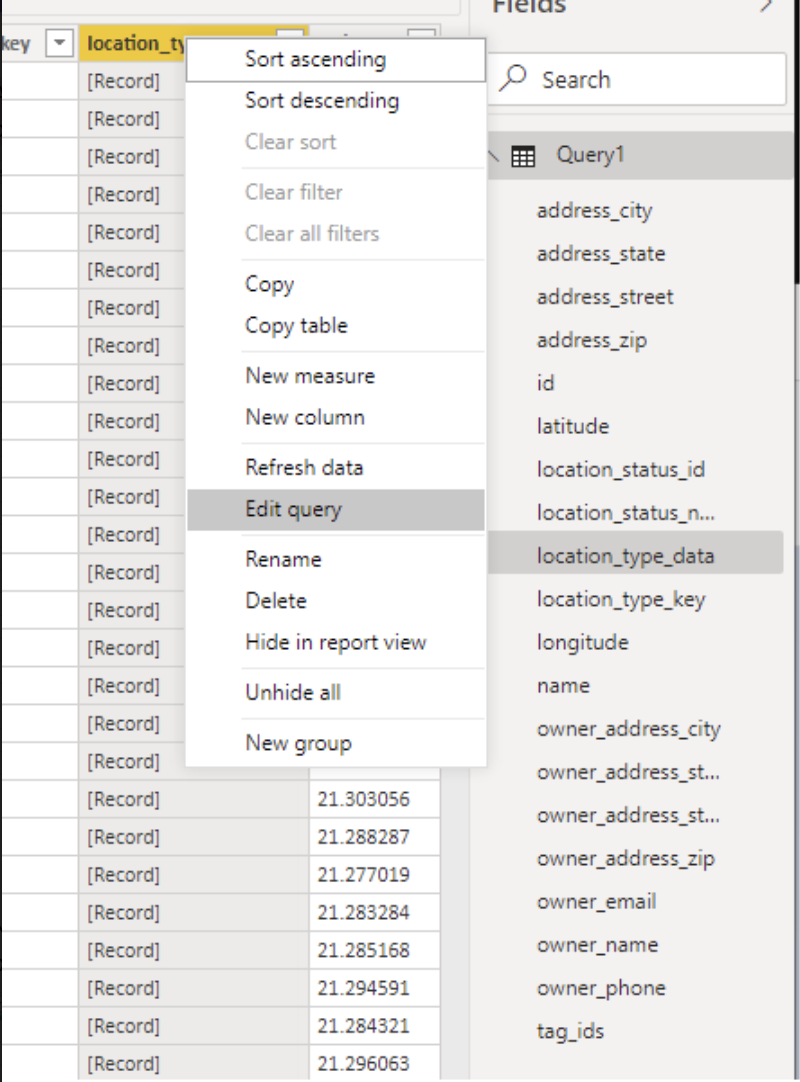
A lot of custom data typically resides in one of these schema-less data columns, whereas more standard or common data's exist as normal columns. To look into and expand the [Record], right click on the column and click "Edit Query". Note that there are multiple ways of doing this, including using the Advanced Editor and writing the queries out manually via Power Query M language.
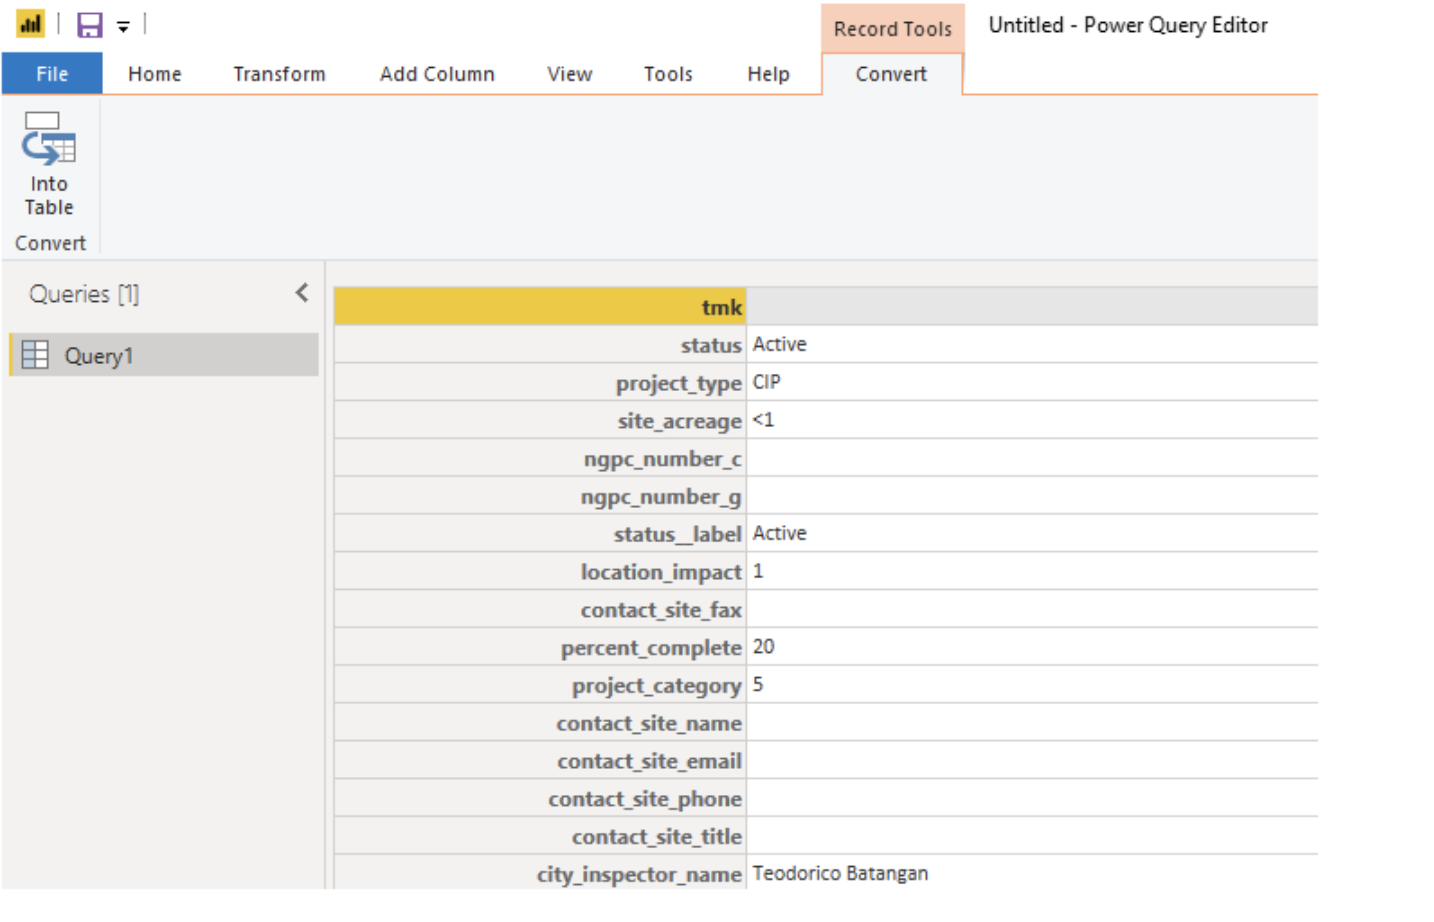
Now that you're in the "Query Editor" window, you'll see the same column of data, but you will notice that now you can either click on the "double-arrow" icon in the top-right of the column, or you can click on the [Record] itself. Clicking on the "double-arrow" icon would allow you to search for any field or parameter in that [Record].
Alternatively you can click on [Record] and see an easy-to-read expanded [Record] with all of the nested fields that exist under it. You can also transform this data into a more traditional Table by hitting the "convert into table" button.
From there, your query now is just a normal Key/Value Column/Row relational table, and you can visualize the data as you would normally expect in PowerBI.